You must use python script. Open command windows with administrator
privilege. Then go to python directory (mine is python 3.5.1) to run
script. Use the command "pip" (Pip Installs Packages, a
recursive acronym!). You already have it when you install Python
package from python.org.
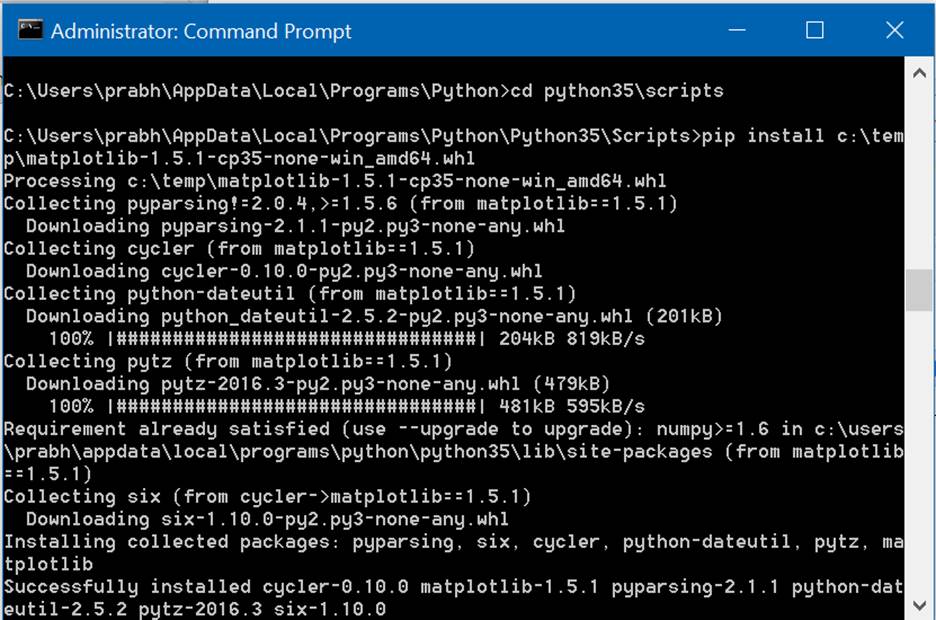
        c:> ... \python\python35\scripts:  pip install <your binary
        numpy file>
Here is the screen dump while I install it. Read the first two lines.
Where
to get windows binary numpy file?
go to: http://www.lfd.uci.edu/~gohlke/pythonlibs/
Look for NumPy. There are several versions. Get the one
compatible with your python installation, for example, mine is python
3.5 and my machine is 64-bit and I install 64-bit python.
Therefore the file for my setup is:
numpy-1.11.0+mkl-cp35-cp35m-win_amd64.whl
(123Mbytes, use right click "save as" to download)
If you have other python version, or you install 32-bit python, get the
appropriate one. (cp3x...win32)
To try the examples in the lecture slides you also need to install matplotlib.
This is the binary package (compatible with my machine
configuration). You can get from this site
https://pypi.python.org/pypi/matplotlib/
matplotlib-1.5.1-cp35-none-win_amd64.whl
(6 Mbytes, use right click "save as" to download)
To run plot, it needs a visual c++ redistribution 2015 (the run time
system) which you can find from Microsoft. Check your machine
configuration if you don't already have it, you need to install it
too. (For Windows system, go to Control Panel > Programs >
Program and Features)
https://www.microsoft.com/en-us/download/details.aspx?id=48145
last update 11 Apr 2016